Why the Project Is Called RollupDB
A rollup is what monitoring people have called this for decades. You take sixty one-second readings and roll them up into one minute. Then sixty minutes into an hour, and so on, until a year of data fits on a page. Spreadsheets do it with subtotals, OLAP cubes do it along their dimensions, and every metrics system that ever ran out of disk has done it to its old data.
So the name says what the database does, in the words its users already use. No metaphor to decode. A RollupDB file is a database whose whole job is rolling data up correctly and keeping the result.
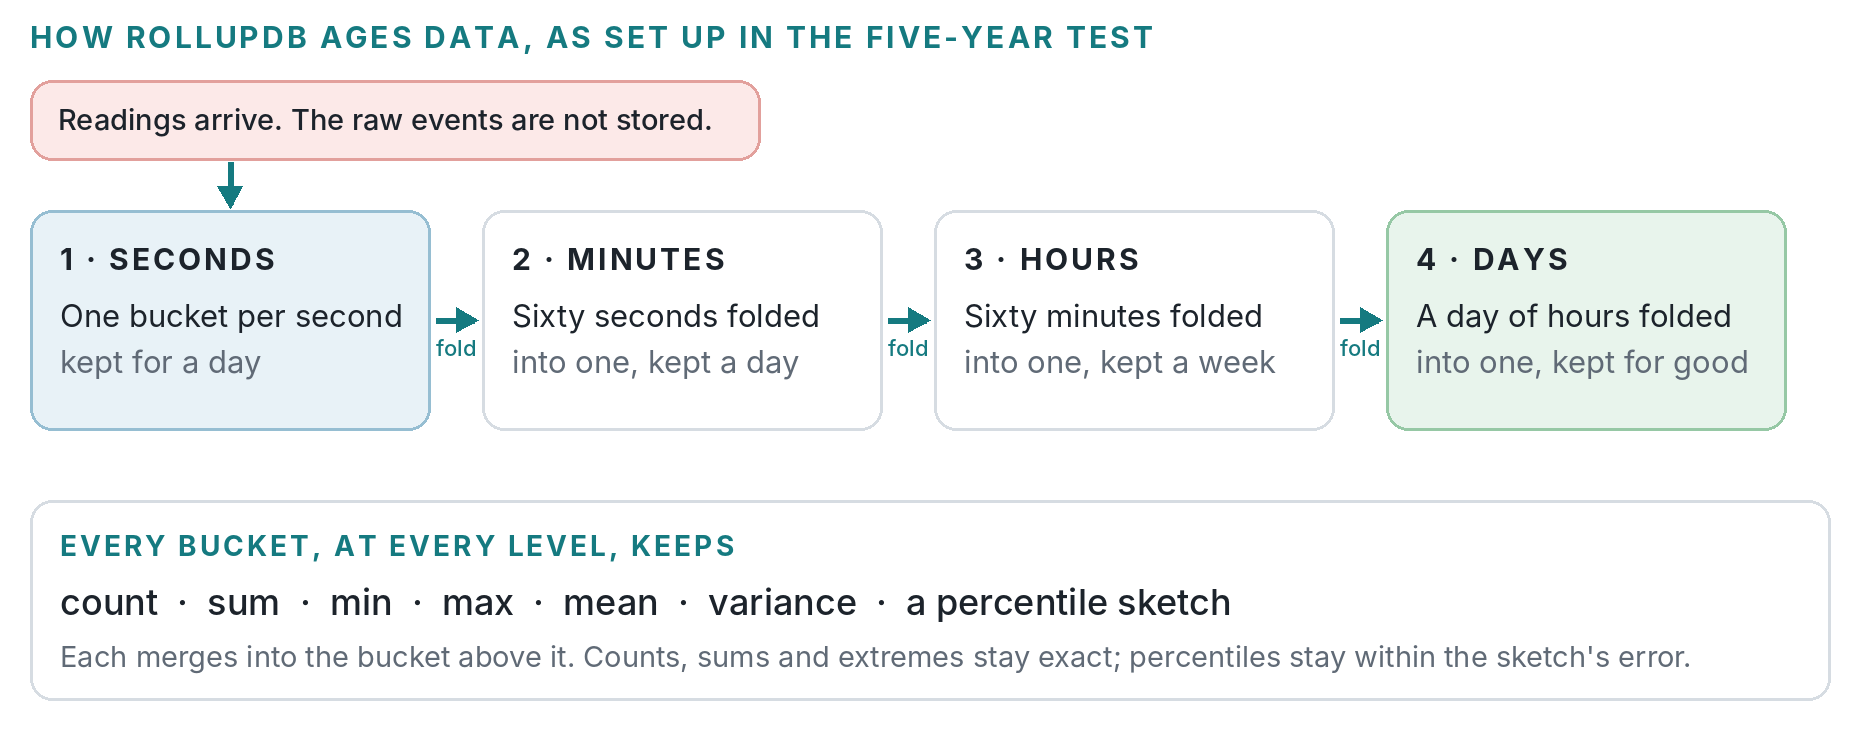
The “correctly” is the part the name hides. The usual rollup keeps the averages and throws away the rest, and an average of averages is wrong the moment one minute had more readings than another. A p99 rolled up from p99s is wrong every time. RollupDB rolls up the pieces instead: counts, sums, extremes, variance state and a mergeable percentile sketch. A day bucket then gives the answers its 86,400 seconds would have given. How that works
The other half of the name is the DB. It isn’t a script that summarizes log files overnight, or a feature bolted onto a bigger system. It’s a database with a file format, transactions, a query interface and a promise about what survives a crash. You declare the stream, feed it readings and ask it questions. The rollups happen in the same transaction that removes the fine buckets, so a query never counts the same reading twice and never finds a gap where a rollup was half done.
Rollup, then DB. It does what it says.